import numpy as np
import matplotlib.pyplot as plt

x = np.linspace(0, 10, 500)
plt.plot(x, np.exp(-x / 4) * np.sin(2 * x))
plt.xlabel("t")
plt.ylabel("amplitude")
plt.show()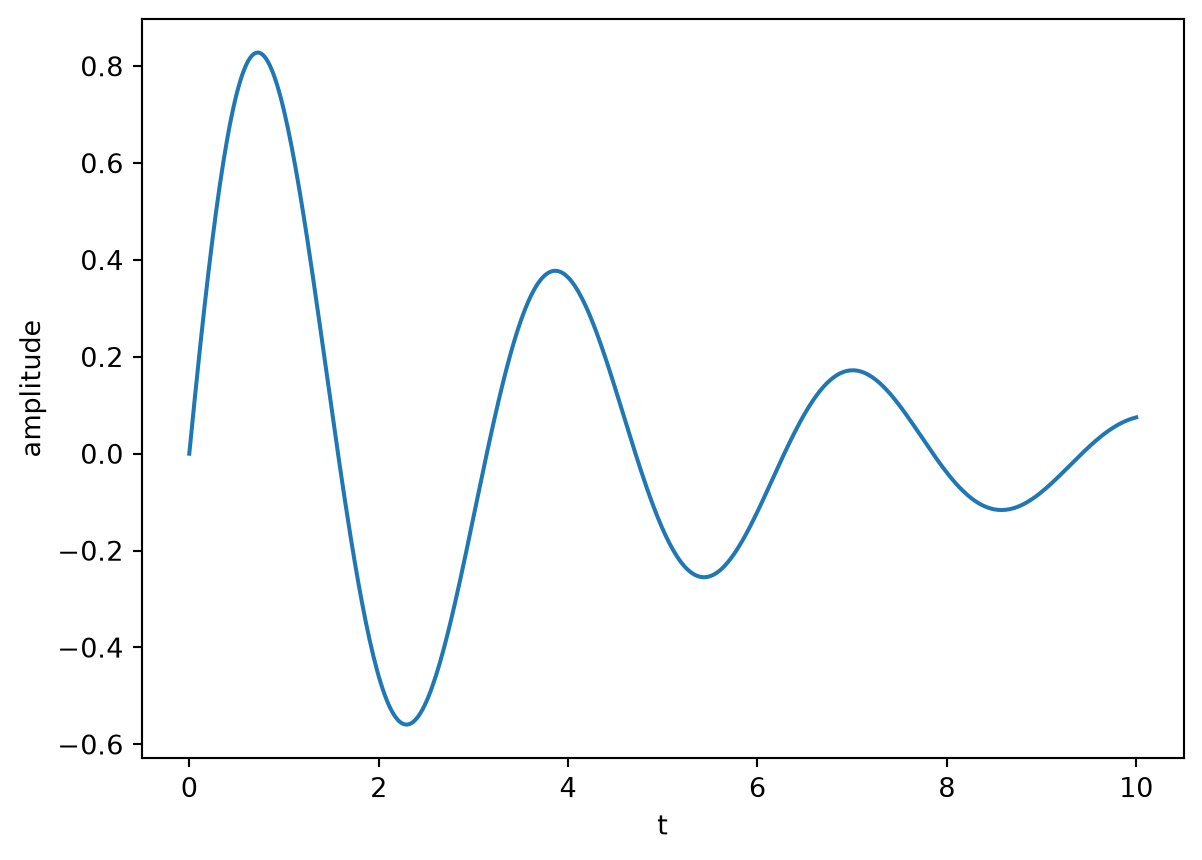
A little reference post that exercises each rendering feature in HTML, PDF (Typst) and Word. Written by Claude Opus 5.5.
Bold, italic, strikethrough, inline code, H2O, E = mc2, and a footnote.1 Links to other posts use the source path: Hello World.
A block quote.
Inline math \(e^{i\pi} + 1 = 0\), and a numbered equation, referenced as Equation 1:
\[ \int_{-\infty}^{\infty} e^{-x^2} \, dx = \sqrt{\pi} \tag{1}\]
| Format | Engine | Interactive |
|---|---|---|
| HTML | Pandoc | Yes |
| Typst | No | |
| Word | Pandoc | No |
Table 1 lists the outputs built for each post.
Code is executed at render time [1], using NumPy [2] and Matplotlib [3]. Figure 1 shows a single plot and Figure 2 shows a multi-panel layout.
import numpy as np
import matplotlib.pyplot as plt
x = np.linspace(0, 10, 500)
plt.plot(x, np.exp(-x / 4) * np.sin(2 * x))
plt.xlabel("t")
plt.ylabel("amplitude")
plt.show()rng = np.random.default_rng(0)
data = rng.normal(size=1000)
plt.hist(data, bins=30)
plt.show()
plt.scatter(data[:-1], data[1:], s=4)
plt.show()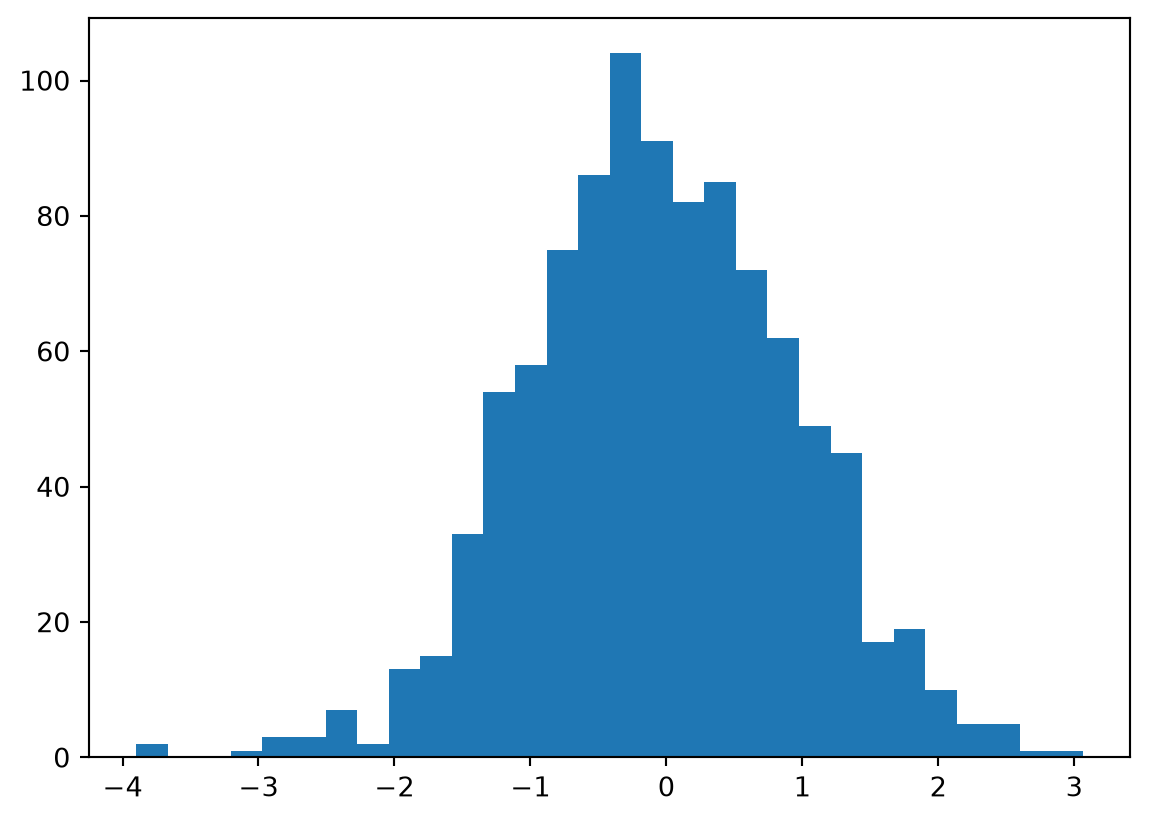
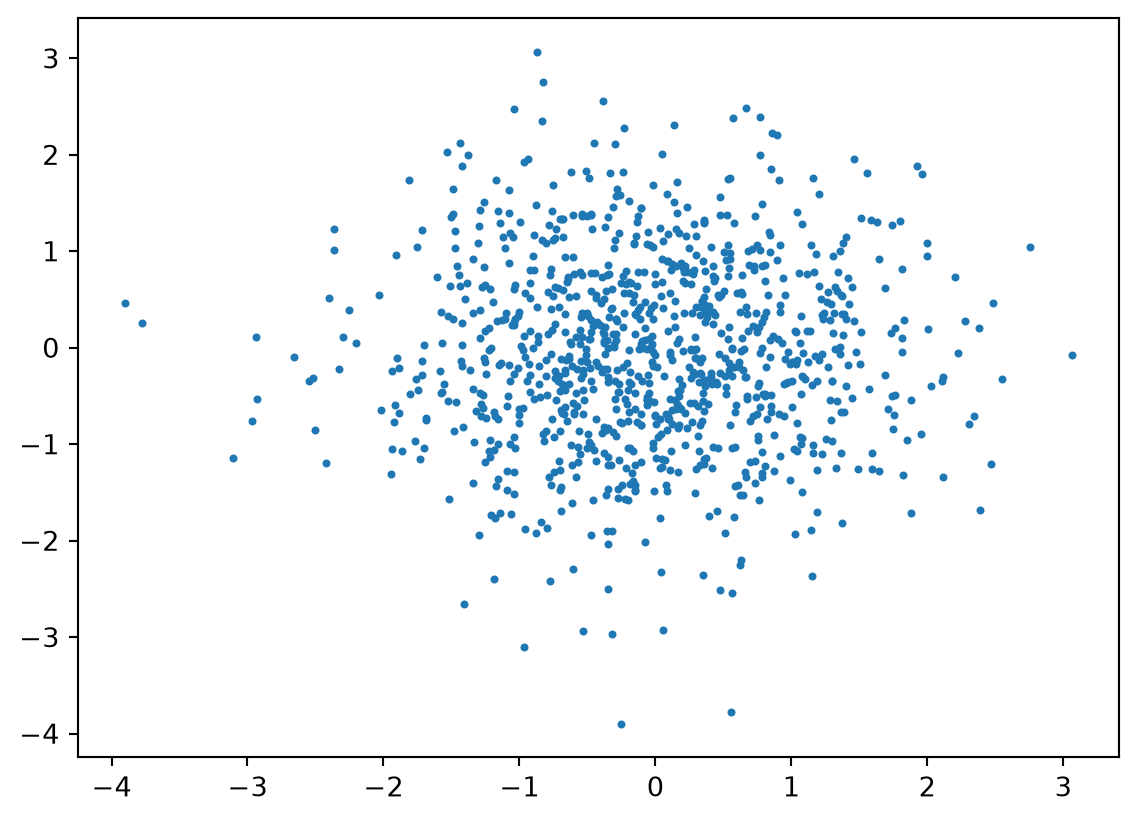
Figure 3 shows how a post is rendered.
flowchart LR
  A[.qmd] --> B[Jupyter] --> C[Pandoc]
  C --> D[HTML]
  C --> E[Typst PDF]
  C --> F[Word]
sequenceDiagram
  Author->>GitHub: git push
  GitHub->>Actions: trigger workflow
  Actions->>Pages: deploy _site
A note callout.
A warning with a custom title.
Collapsed by default in HTML.
example.py
def greet(name: str) -> str:
    return f"Hello, {name}!"
quarto renderTabsets are interactive in HTML and render as sequential sections elsewhere.
Second tab.
This paragraph only appears in HTML.
Footnotes render as sidenotes or endnotes depending on format.↩︎